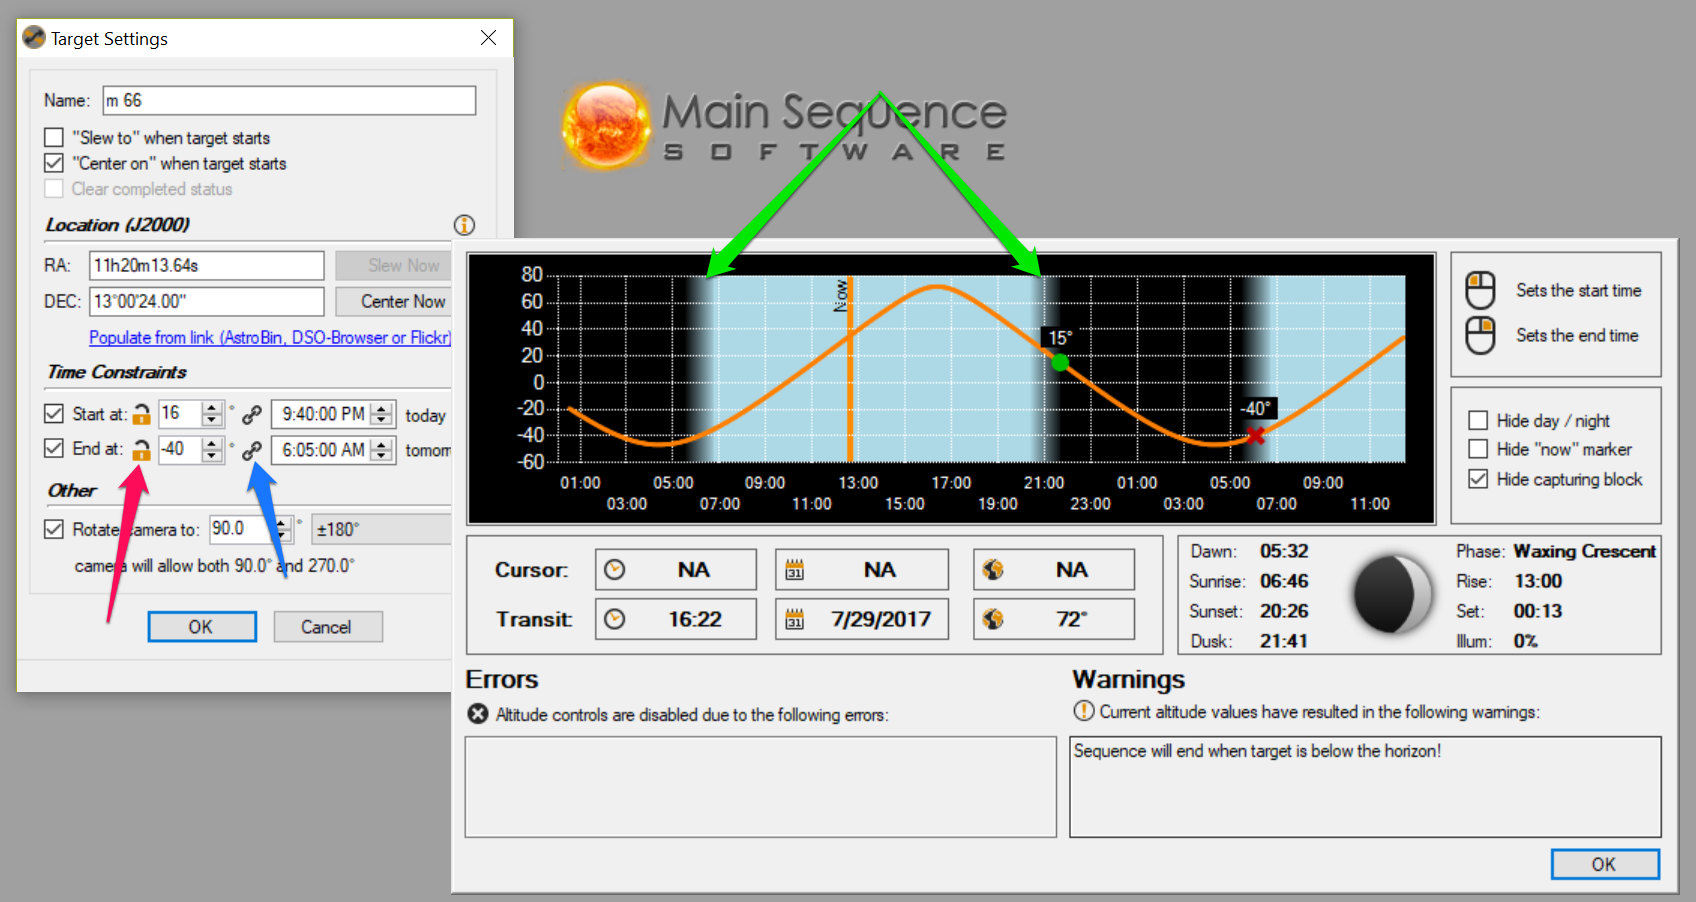
Altitude lock: The red arrow shows the UI for toggling the altitude locks for start and stop. When altitude is locked, start time will vary in order to meet the request.
Altitude Time Link: Blue arrow. When the link is solid, it indicates that the altitude and time are linked. Because these two values may diverge when an unreachable altitude is requested, this icon will show a broken link to indicate the time and altitude have diverged. Attempting to start a sequence in this sate will generate an error.
Day / Night indicators: Green arrows.The light colored areas indicate daylight and the gradient accurate shows twilight. In this way, any “black” area on the graph should be suitable for imaging.
Solar planning data: View exact dawn, dusk, sunrise and sunset times.
Lunar planning data: View phase, illumination and exact rise and set times
Options to toggle certain viewable elements of the graph in order to avoid clutter.
You can adjust target start / end times by using the numeric and date controls (even while the graph is open) or you can click the graph. It’s pretty flexible and, with it, you can:
Set target start and end times (from target settings), as normal, and see what altitude those times correspond to. This does not need the new visual aids. It works just by updating the times in the form.
Set target start and stop altitudes and see what times those altitudes correspond with. This does not need the new visual aids. It works just by updating the altitudes in the form.
With the new visual aids, click on the “i” next to the “Location” section, you can:
View target ephemeris graph showing the target altitude, over time
View capture time markers:
The green dot shows start time / altitude
The red X graph shows end time / altitude
The vertical white line is “now”
The shaded green area shows the time frame for which this target is allowed to capture
You can now left click on the graph to select a new target start time
Right click on the graph to select a new target end time
View errors and warning associated with current settings
No lat / long set error
Target has an invalid location error
Desired altitude is below the horizon warning
Desired altitude is low warning
View the target’s next transit time and altitude (+/- 2 min)
This is pretty complex and I am not sure I understand all the implications of the new functionality. I think I will have to see it live.
I was expecting a much simpler logic, something along the lines:
The Sequence has a start time (this would normally be the start of the darkness or whatever start time the user feels like entering) and an end time.
Each Target has start and end altitude settings.
After the user activates the sequence, SGP first waits until actual time > sequence start time.
It then looks if the first target is higher than the start altitude. If positive, the target will be activated and the events for that target will be executed. The target is active as long as the target altitude > end altitude and only as long as the sequence end time have not been reached.
If, on the other side, the target is below the start altitude, SGP tries the next target in the sequence.
If none of the targets can be started, the loop starts again with the first target, as long as the end time for the sequence have not been reached.
After completing a target, the loop starts again from the beginning. Completed targets will be marked as complete and dropped from the loop.
This would be, for my use case, the ideal way to control the use of the available darkness.
It’s pretty simple. Look at the graph and choose start / end times… nothing more complex than that. There are no new implications. If you did absolutely nothing, you would not notice a difference in how SGPro performs its sequencing.
@Horia You are conflating two different features. The graph is a planning aid designed to visualize your target sequencing and not (necessarily) the way you interface with target start and end features… This graph is related to what you are asking, but only in the sense that it provides visual queues for those things. You’ll notice that, in the image, above, if you close the graph, you are left with exactly what you are asking for… Clean and simple, just start and end time with altitude. If you decide you’d like some more information to help you select the right start and end times, open the graph and click away.
I don’t understand this, why introduce 2 start constraints? Why not just start when the target altitude is in the correct position?
This is perfect. I somehow understood that I have to use the planing graph if I want to have start/end altitudes.
Let’s say, on a given day I have the following situation:
Darkness starts 22:00 and ends 6:30.
Target1 rises 17:00. This target has only about 2 hours of aquisition left from a previous day.
Target2 rises 23:00
I would like to have, for both targets, the aquisition start no sooner than 30° above the horizon and end no later than 20° above the horizon.
For that day, I have to activate the sequence sometime in the afternoon and leave it alone, expecting it to:
start at darkness.
go to the target1, as it is well above the 30° and finish it.
then wait for the traget2 to be over the 30° limit
start aquisition on target2
stop everything when target2 is completed or when target2 goes below 20° or when the morning comes (whatever comes first).
So this is why I would like to have both conditions. As you see, I was thinking more on the automation side of the story and less about planing the night.
Anyway, having start and stop altitudes is great and I wait for the release. If you would also implement a function to remove the clouds …
@Ken
Wow - that looks impressive and considerably more than I was anticipating. Like some others, I would have been happy with a simple minimum altitude box. The addition of the day/night is very useful. I traditionally open up AstroPlanner and work out when it is dark enough to start a sequence, then look at the time when the altitude clears my local horizon. If the day/night indicator alters with season, then I can dispense with AstroPlanner for this purpose.
On that note - AP makes a distinction between the different day/night transitions. I think they are civil, nautical and astro. I tend to use astro or nautical. If it can be done, a marker on the graph would be a great help.
Not entirely sure what this means, but day / night and twilight indicators (gradient) are 100% accurate to your locale. As seasons change or daylight savings or whatever, that will still be accurate. Is that what you are asking?
Why is this? Are you interested in more types of twilights than the one that helps you plan when to start and stop talking images (typically referred to as the “Amateur Astronomical Twilight”?
A single threshold may not necessarily work for the whole year (though it will suffice for 80%). At latitude 50, there is a 6-week period where you do not get true astronomical twilight (according to AstroPlanner). In the winter, one can be patient and get a deeper darkness before imaging. It is a bit of a judgement thing. I don’t think it ever extends to civil twilight - but hops between nautical and astronomical. Just a suggestion but a couple of tick points along the time axis may be all that is required.
Interesting… I had never considered that. This is more of a real-estate problem than a data problem. We have access to all this data… just need to figure out how to display it all w/o making the graph a hot mess.
@Ken
One way would simply be to not use a graduated background but just have black and pale blue, with a dark grey stripe in-between? The black would be your true astro darkness and the grey would be the twilight bit, where you would perhaps do flats, autofocus, centering and cooling down, or in the summer, bright objects like clusters…
This is a great addition that will save some time with the planning of observing sessions. I have been using the following site to determine the visibility of objects from my site, in conjunction with GUIDE Version 9.1.
I wish to propose some slight changes to this very useful feature.
I do not see why the UI is showing the daylight hours of the day and of the previous night when this space could be devoted to a single night with a resultant higher temporal resolution.
Perhaps an option to show all events listed for the night are shown together with the one highlighted being the one where the data could be modified. This way in one go, it would be possible to visualise the start end times of each event without having to refer back to the time constraints dialog box.
An altitude lock specified at certain elevation above the horizon would draw a horizontal line across the graph that would help to show when the object would reach a specified altitude. This would also help to visualise the actual times when the object is available for observation above the specified altitude.