Hi Jerry,
my rig consists of a SkyWatcher Esprit 150ED of 1050 focal length and a ZWO ASI1600MM Cool with a pixel size of 3.8micron and 0.74". The focuser has a home-made 1:16 geared planetary drive.
Nicolàs
Hi Jerry,
my rig consists of a SkyWatcher Esprit 150ED of 1050 focal length and a ZWO ASI1600MM Cool with a pixel size of 3.8micron and 0.74". The focuser has a home-made 1:16 geared planetary drive.
Nicolàs
Its great to see your work on improving the algorithm to better fit the HFR data points but we need to keep in mind that the best algorithm in the world still relies on the quality of the underlying data it is trying to fit. The varied shapes of the HFR plots clearly show how difficult it is to scan a pixel array to identify stars, calculate accurate HFRs, discard blobs of nebulosity, eliminate backgrounds and ignore hot pixels. Then its necessary to analyze the resulting data set to come up with an accurate HFR value that truly represents the entire image. It is my personal opinion that what Ken and Jared have accomplished is pretty impressive. So, it might be equally important to work on an algorithm that can do a better job of producing those initial HFR calculations.
Charlie
@jmacon
I did some searching on the internet for asymmetric parabolas and the best idea I found was joining two curves at some inflection point. That sparked an idea that you might apply to your data sets. It’s likely that each side of the focus curve can be fit to a parabola just not necessarily the same one. It’s pretty easy to determine the minimum point and bifurcate the data and do separate curve fits with each side. You would then have two minimum points would you would need to resolve to a single minimum. There might be some fit test you could apply to decide whether the best fit is one or two curves.
As @chasmiller46 points out, curve fitting is probably the least of the problems. If a data set is robust, linear fit seem to work just fine. Using a more advance fitting algorithm is not going to fix bad data.
@DesertSky, your suggestion is a very good one. It should be able to get good results for asymmetric curves. However, I have already implemented something that pretty much does the same thing. Using the quadratic routine I derive the slope of each side of the asymmetric parabola. Using these different slopes, if they differ significantly, I can derive a good asymmetric best focus point. I am now testing the asymmetrically enhanced routine against my database of logs.
The team is also close to being able to display graphs that combine the quadratic curve, focus data, points, and the Q best focus and SGP best focus points. With these it is much easier to visualize the results we are getting. We will present many examples when the graphing is done.
@chasmiller46, you are so right that work on improving the star detection area is the other major aspect that needs improvement. The developers are taking a look at that.
To those currently having difficulty getting good, consistent V-curves - check that your focuser is not slipping. After adjusting mine and slowing down the motor speed, I now get nice consistent V-curves with good symmetry.
Summary of project results:
Our quadratic routine project is ready for implementation. We have refined the algorithms to the point where it gives excellent results for a very wide range of focus curves. We have processed over 1000 curves from 11 different users covering a wide range of hardware, focal lengths, pixel resolutions. It accomplishes everything we set out to accomplish in the initial presentation.
Here is a summary of its rules for determining best focus:
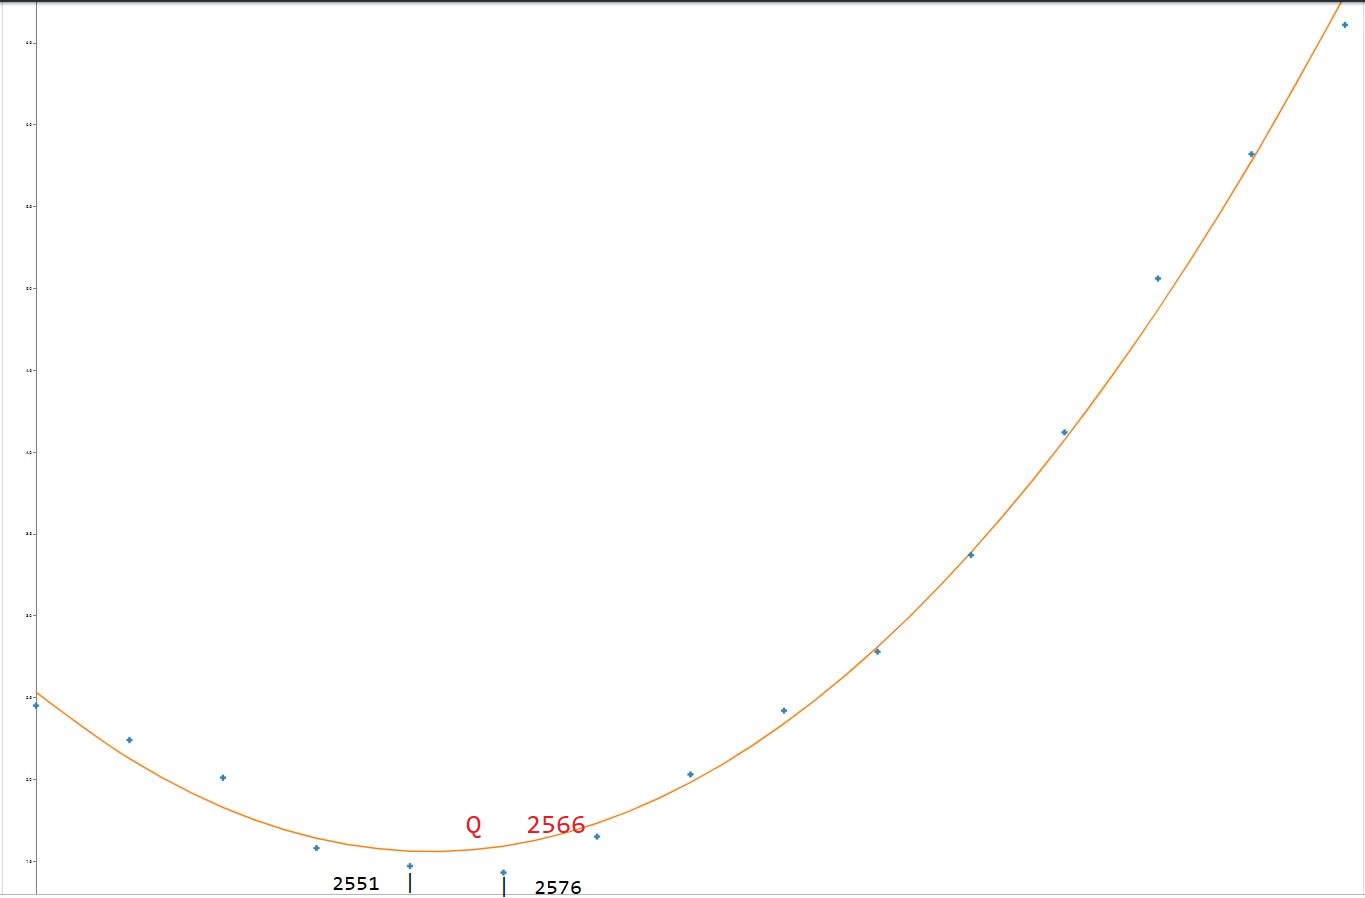
Here is an example of the effectiveness of using a quadratic fit for an asymmetric curve, where a small adjustment to the quadratic best fit (lowest point on curve) was applied based on the relative slopes of the two sides of the curve. This curve came from Rob Musquetier.
I could give many additional examples, but I want to keep this really simple. This routine WORKS!
The routine is tested and ready for implementation. It solves very serious problems with the current focus routine, and also provides the perfect Quality measure that will be needed for implementing the focus rerun feature that you are adding to version 3.
@Ken and @jared, are you interested in implementing our routine into SGP at this time? It is programmed in C++, and is actually quite short and relatively simple. It is a single routine and should be easy to plug into SGP to replace your current routine that determines best focus.
In a perfect world, this would be available as an additional focusing option so that users can test which one they prefer.
In any case, the efforts of putting this together are very much appreciated.
FWIW The asymmetry is very obvious with a slightly mis-collimated RCT. I have used the shape of the focus curve in the past as the final confirmation that I finally got the mirrors lined up.
How are you calculating the slopes? It sounds like you are reverting to a linear fit for each side?
You have tried this on many runs but how to you determine whether the result is valid? That is, at the best focus point? You can’t just look at the curve and call it good. Have you tried to develop an improved linear fit algorithm and compared the results?
I use a linear fit to determine the slopes. However, the quadratic curve result is the main determinant. The slopes of the sides only produce a minor adjustment to the result from the Quadratic fit. The Quadratic fit actually works quite well even for asymmetric curves. See the example I just posted.
And you know this how? Do you have some independent data (e.g. a bahtinov mask) that demonstrates that you have the right focus value? Without some other means to determine the best focus, this is just an interesting mathematical exercise. You have to demonstrate that you have really found the best focus and not just some curve minimum.
Your whole commentary is irrelevant here. There is no magical independent data involved. We are just trying to find the best focus defined by the focus points that this one focus run produced. To be relevant to what we are doing here, you have to make an argument that the focus point the routine chose as best is really not best.
I think you are missing my point. You have some data which to which you have fit a parabolas. You could certainly use the same data to do a linear fit algorithm. So how do we know which of these two methods gives the better results? Without some independent verification, we don’t know whether your method produced a better result than the method used by SGP and FocusMax. Just looking at the curves does not demonstrate that the parabola method is better. Fitting a symmetrical parabola to asymmetric data is in itself problematic. The linear fit method does not have that issue. Comparing each algorithm’s result to something like a bathinov mask would confirm which is superior. The linear fit approach seems to have a long successful history. For a parabola fit method to replace linear fit, there needs to be some solid data to support that. Just looking at the curves does not provide that confidence.
Basically you can’t use the data that you use to determine a focus position to demonstrate that the position found is a good one. You need separate independent data to do this.
Exactly, well put
I am so baffled that neither one of you understands the point of this entire thread. Let me start by asking you 2 simple questions:
if a focus run produces a perfect V, would you want SGP to choose a best focus value far to the left or right of the bottom point of the V?
I gave 11 real examples of focus curves in my initial post of this thread. Please point out a single one where the best focus chosen by our Quadratic fit routine is not as good or better than the one chosen by SGP.
Come on guys. You are introducing factors that should not be a part of this thread. This thread is entirely about what best focus position should the program determine, and then move your focuser to that position and quit, or rerun if the focus run is bad.
The ONLY data/factors that SGP has to base this decision on is a set of 2 dimensional data points. It is precisely a geometric problem. There is no Bahtinov mask here, there is no additional evidence to help us make a better decision than a pure geometric problem. There is no issue of is this “really” the best focus position.
Unless of course you want to add a lot more complexity to the decision based on results of the immediately preceding focus runs. I’m sure Ken will respond very favorably to that one.
I suggest you both carefully reread my starting post a the very top of this thread. It answers all your questions, and even offers some additional proof that the best focus Q came up with which differed considerably from SGPs choice, was in practice actually better based on excellent V curves just before and after.
If you want to discuss the practical comparison of how reliable a focus run with V curves is at predicting the “true” focus determined by some other method, be my guest, but I kindly suggest you start another thread.
Please comment specifically on the results our method has produced on real V curves.
@jmacon I already commented on your initial 11 graphs and what I saw as some short comings of the approach. We can’t just look at the graphs to determine that one approach is better than the other without knowing the ideal value.
@Chris You said in an earlier post “The physics is that the light cone - which is what these plots show - is a hyperbola. I provided references in another thread. But if fitting to a parabola is easier then it won’t do much harm.” I asked for those references but so far no response. I agree that the light cone is a hyperbola but I think you may be confusing the light cone with the focus curve (e.g. focuser position vs HFR)
@jmacon Your assumption from the beginning has been that a parabola was an accurate curve to use, however, I pointed out that that approach may be suspect as there are some compelling resources that indicate that the slopes of the “V” are linear. Mathematically speaking fitting a parabola is easier than a linear fit but that does not provide any guidance as to the best method. Granted, gathering the necessary data to confirm the results requires a lot of work but it is necessary to validate the approach. We can’t expect to SGP to change its method based solely on the looks of the graphs. That’s not to say that the current SGP algorithm can’t be improved to make it more robust.
Totally false.
Absolutely true. The true physics of the light cone does seem to be a hyperbola. Many tools work effectively when applied wisely. Straight line, parabola, hyperbola, they all work. I have chosen to use the parabola and straight lines. It works well as you can see from my examples. Fitting to a hyperbola is likely more complex. We are trying to get Ken to actually IMPLEMENT improvements to his routine. It has serious problems which my parabola approach has solved really well. If you want to spend many hours implementing a hyperbola approach, go for it. If you doubt the effectiveness over a wide range of curves I am happy to send you all 1500 of them and you can check them yourself.
I am not claiming my approach is the best possible. I know it is not. The most effective is probably a combination of all three of these approaches. I am using two of them, straight line and parabola. In a later closing post to this topic, which will come soon, I will present the approach and feature set of what I think is the best focus routine one could hope for and that SGP should strive toward. (and that a competitive product has already implemented)
My routine is working to solve the specific class of serious problems with the current routine that it addresses. And it is ready. And it is free.
Theoretically correct. My real 1500 example curves say otherwise in practice. If you think otherwise, send me some logs that show curves you think my routine won’t work well for.
Note: I do appreciate that you are back to actually discussing the specific merits of what we have done.
Although I am not a fan of using R^2 as an indication of focus confidence, I am a strong proponent of using quadratic fit near focus to find best focus. There are several issues brought up here that I can address.
Yes the overall wide curve is likely a fit to a skewed hyperbola - but near focus it is an excellent fit to parabola unless there is something pathological going on - in which case you would know it anyway. There are many reasons to avoid higher order fits but the main one is robustness of the fit. The point is - near focus there is no need to fit to higher order - and it would likely hurt the estimate.
As for Bhatinov mask - you can’t really compare focusing methods unless you agree upon a quality metric in the final image. For me, it is a measure of sharpness in the image - and I use measured fwhm - and I assume I can measure the fwhm in a meaningful way. If I optimize the fwhm then by definition I have found the place where the image is sharpest. And if I do error propagation I can provide error bars on how well I found that optimum. This all standard procedure in using a model to optimize some figure of merit and determine error bars in the resulting value. Without a well defined figure of merit and meaningful error bars - you don’t really have a measurement you can discuss with confidence.
Bhatinov mask is indirectly related to image sharpness and can be biased in many ways - and it has no resulting error bars to map to the image quality or confidence in the result - so I don’t see it as any kind of meaningful standard for comparison.
As for V fits - that is based on old work with insensitive ccd’s and a single bright star. If anyone thinks a V fit is better - all they need to do is do the fit on some examples and provide error bars on the result based on proper uncertainty propagation with a model and assumed uncertainties - and compare it to parabolic fit and its uncertainties.
I think any kind of parabolic fit to values near focus should be very robust and only require a few samples. I just recommend additionally estimating the uncertainty in the result.
Frank
No one can because you are using the same data that you used to generate your focus position to demonstrate that your focus position is correct. You can’t do that, it’s bad science.
It’s as rational as tossing a coin three times and claiming that heads come up two thirds of the time and using the original three tosses to prove this.
This invalidates all your claims that your curve fitting generates a better focus position. You have no evidence for this and this applies no matter how many times you repeat it.
This is a shame because your idea of finding a way to detect and remove bad focus data points and determining that a focus curve is bad is good. Fitting to some sort of curve looks like a good way to remove outliers.
But none of this helps with the major problem, that the auto focus only works when already close to focus, to within a fraction of a mm. What a lot of people want, particularly those with remote systems, is a way to find that close focus position. This requires a different way to determine the size of the out of focus star disc or doughnut when it’s 50 or 100 pixels in diameter and out of focus by at least a mm.