Proposal of a "Quadratic Fit" Auto Focus evaluation method

When trying the AF routine of SGP I was intrigued by the fact that I didn’t get “V-shaped” curves but nice parabolas. So I examined the results of all 19 AF runs of three nights (20., 27. and 31. of october) with different observing conditions more strictly. I want to share my results and my conclusion:

Used equipment:
I am using a Takahashi FSQ 106N (focal length 530 mm, aperture 106 mm) which is notorious for a strong focus drift with temperature (it is about -50 µm/K). My scope has the original rack & pinion focuser which has been carefully adjusted by Rèmy at Optique Unterlinden in Colmar. The focuser has no reduction gear. The attachment of the motor to the scope is constructed solidly in order to avoid distortion of the motor shaft which would result in lateral forces to the focuser shaft. The motor is connected to the focuser shaft by a Flexible Shaft Coupling. A Robofocus motor (3600 steps/revolution) and Seletek Armadillo2 controller is used.

In SGP a focuser backlash of 30 steps, direction IN was set. For the AF runs, the number of Data Points was always set to 9, the step size to 17 (= 113 µm) as a starting point. Later on I raised the step size to 25 (= 167 µm) which worked very well. With an even higher step size SGP didn’t detect stars when out of focus.

Evaluation:
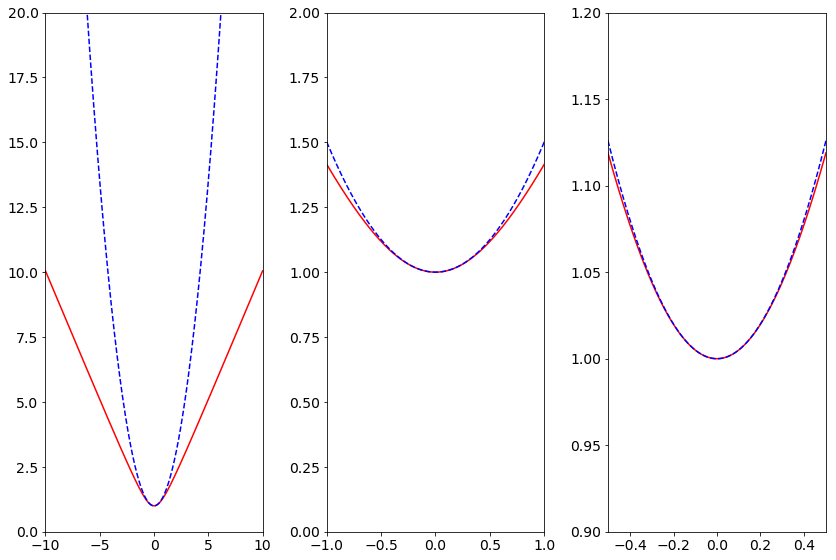
I examined the results of the AF runs by retrieving the following data from the logfiles: focuser positions (fp), HFR values and the focus results (fr) obtained by both “Weighted Average” (old) und “Best Fit” (new) SGP AF evaluation methods. The data of each focus run (HFR vs. fp and fr) were analysed and plotted in a spreadsheet software. A 2nd order polynome regression (“Quadratic Fit”) of each of the curves was applied which provided the coefficients a, b, c of the regression equation (1) and the coefficient of determination R^2 for each focus run:

HFR(fp) = afp^2 + bfp + c (1)

1st derivative:
HFR’(fp) = 2afp + b

The condition for the minimum of the function (HFR’(fp) = 0) provides:

fr = -b/2a (fr is the fp at the minimum of the regression curve) and
HFRmin = -(b^2/4a) + c (HFRmin is HFR at the minimum of the regression curve)

The regression equation (1) thus can be transformed to a different representation (2):

HFR(fp) = a*(fp - fr)^2 + HFRmin (2)


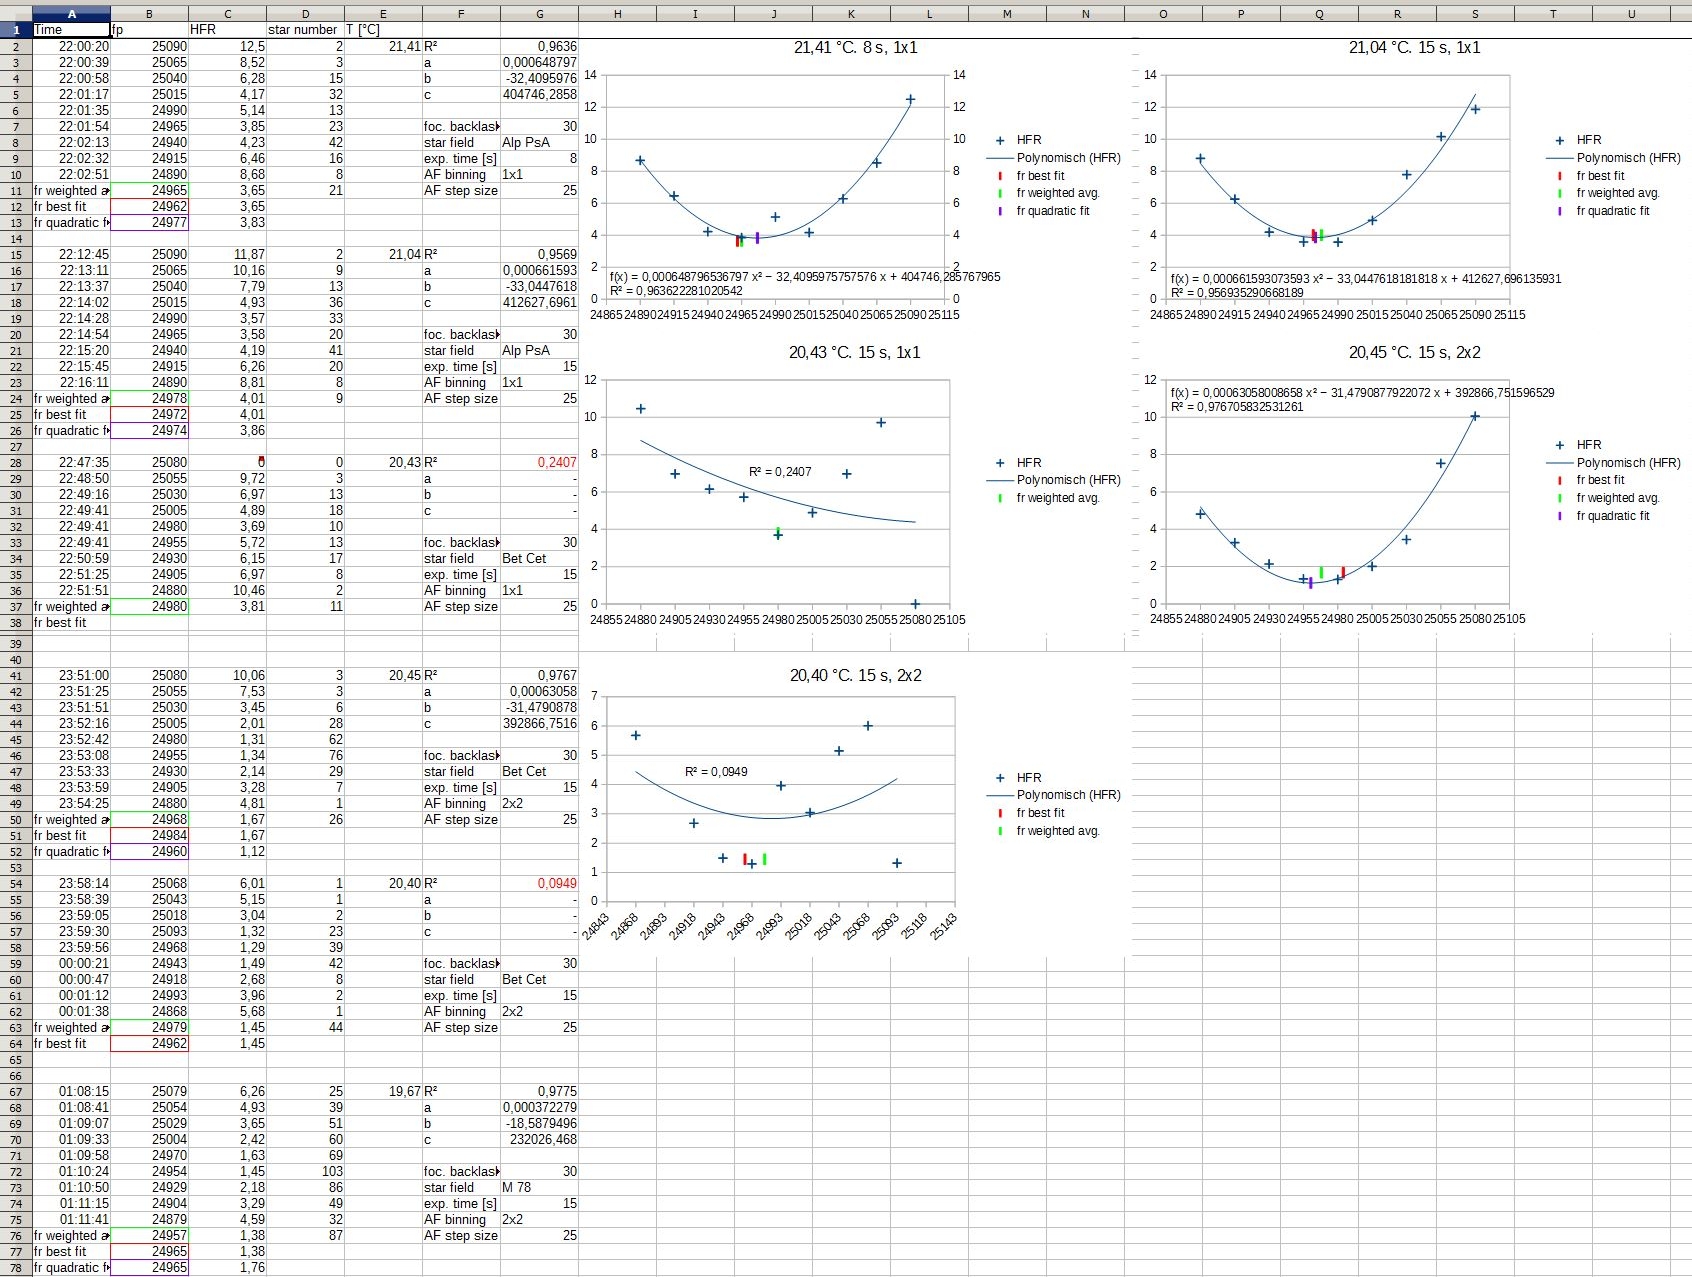
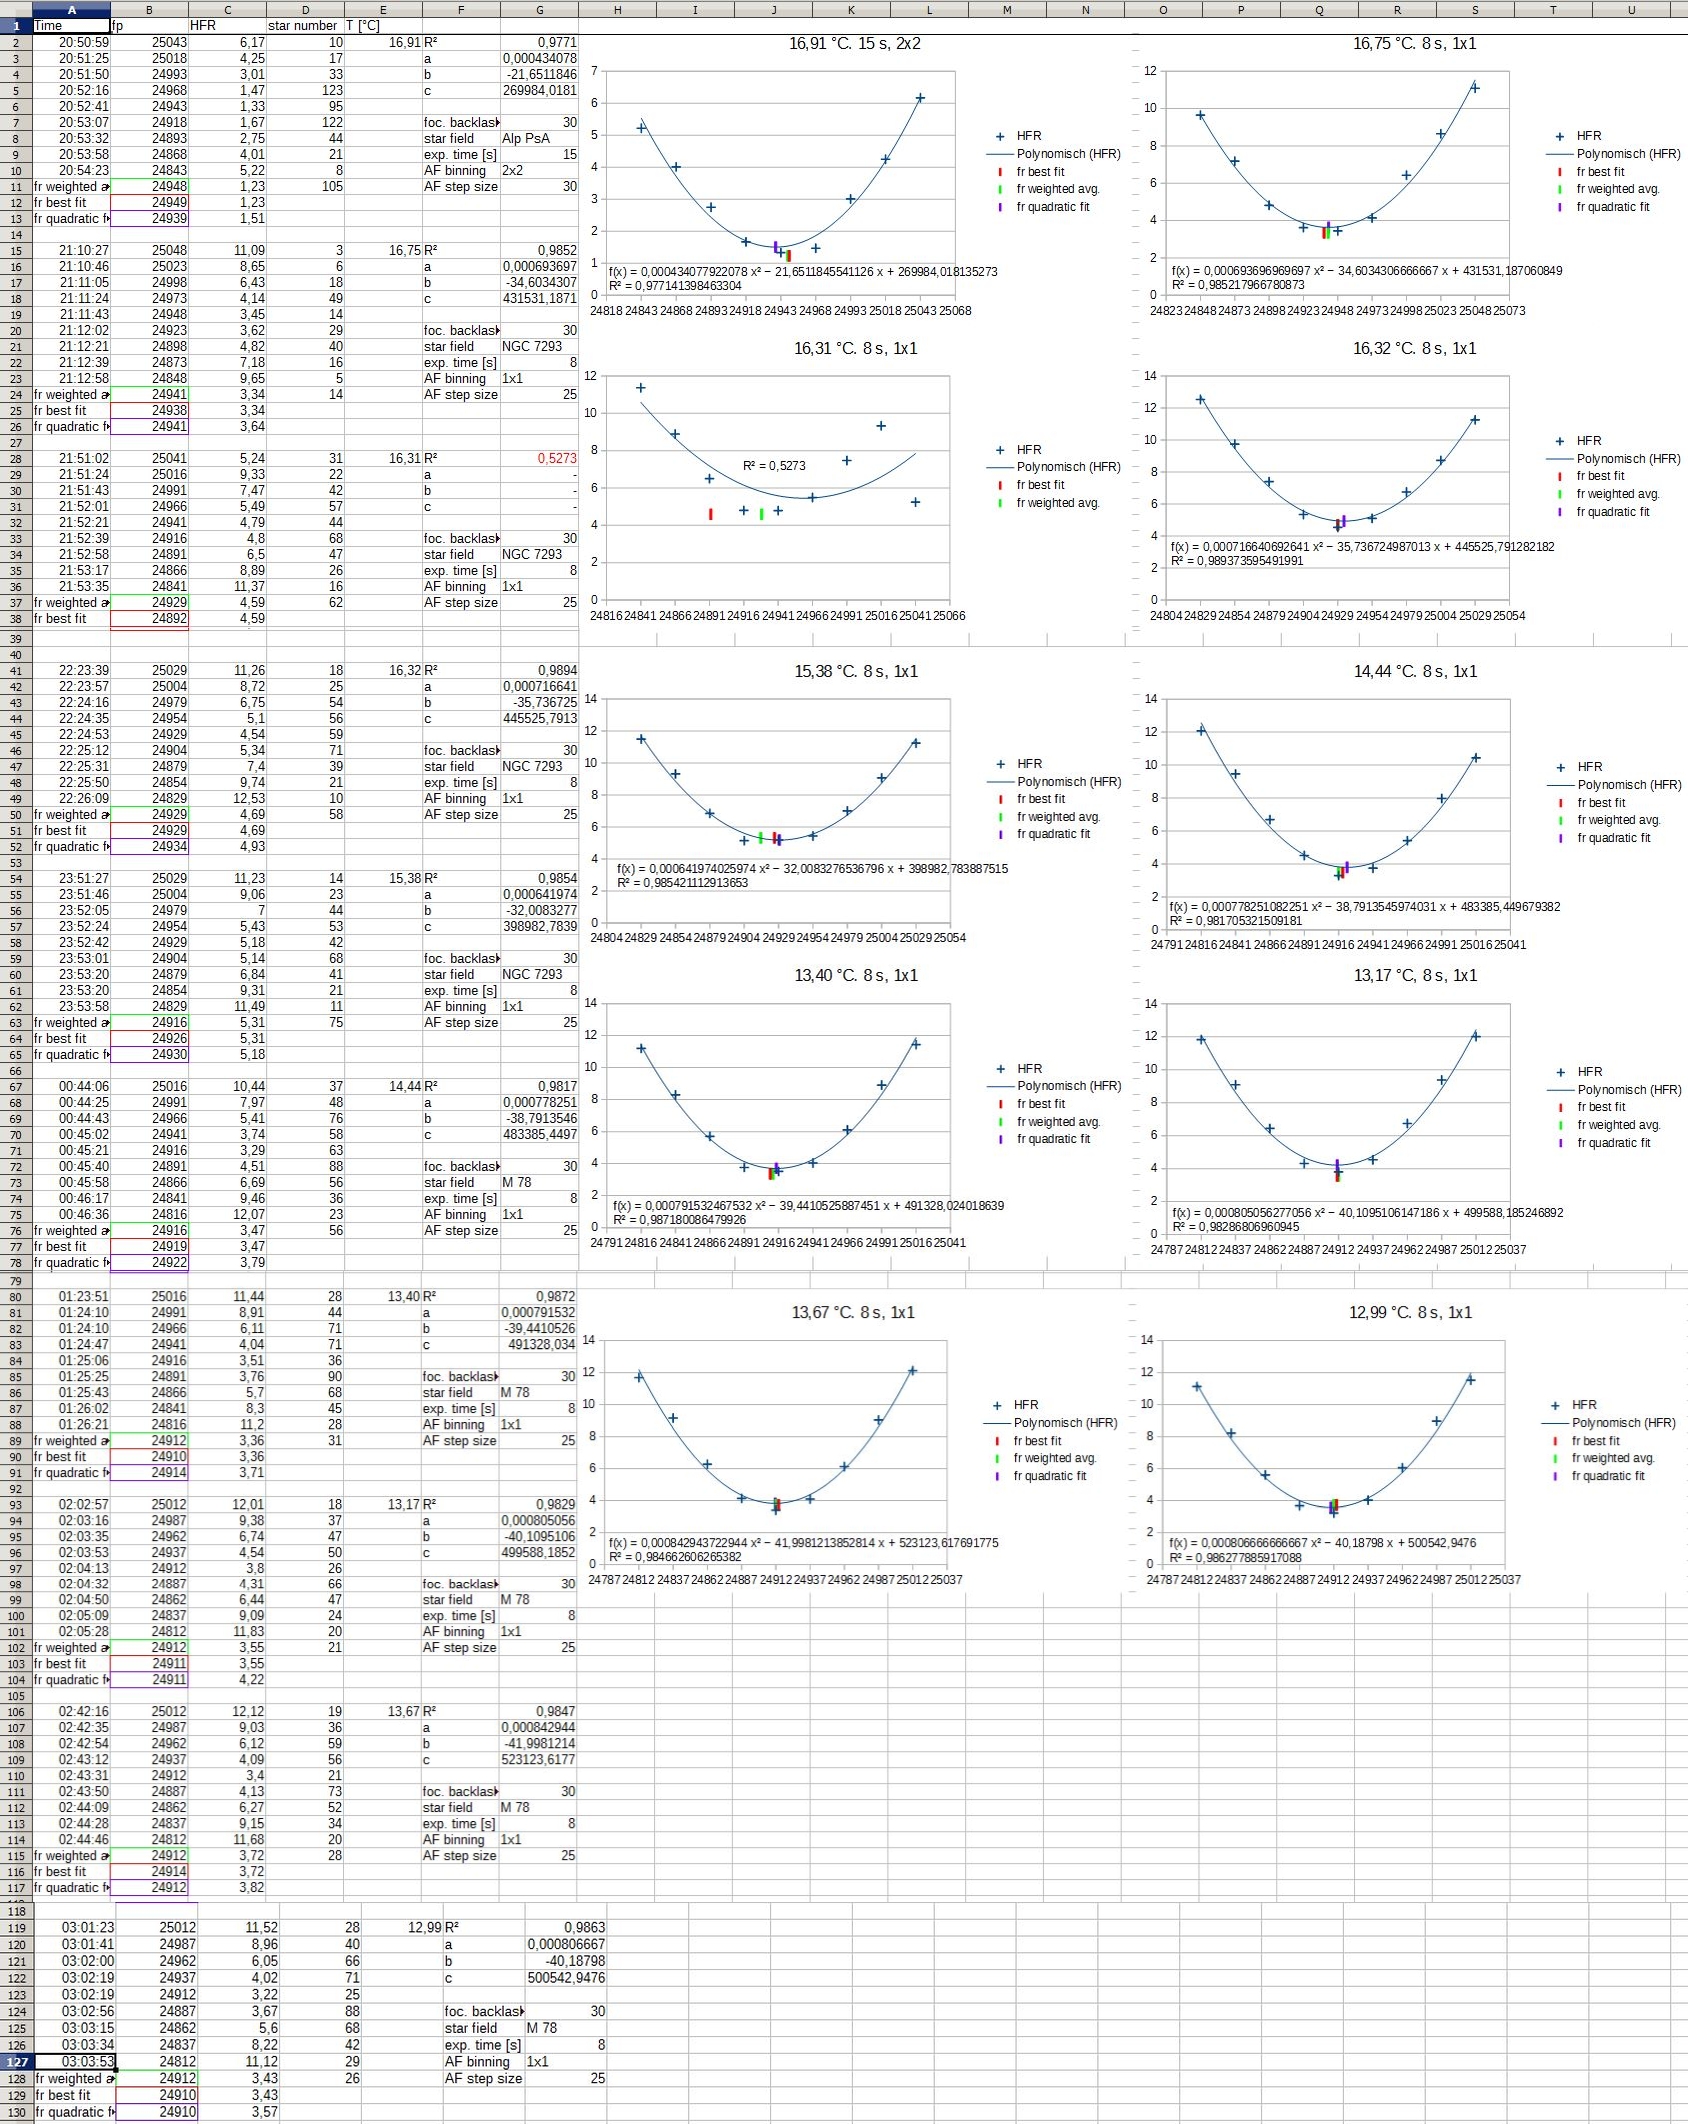
For decent (16 of 19) AF runs the “Quadratic Fit” was very good, R^2 being in the range of 0.960 to 0.997, in most cases between 0.975 and 0.997 (images 1 to 3). 3 AF runs were poor, with R^2 of 0.527, 0.241 and 0.095 respectively. Two of the poor AF runs were influenced by the bad conditions in the second night, when thin clouds came up. At the third poor AF run the very first HFR value deviated heavily from the expected value.

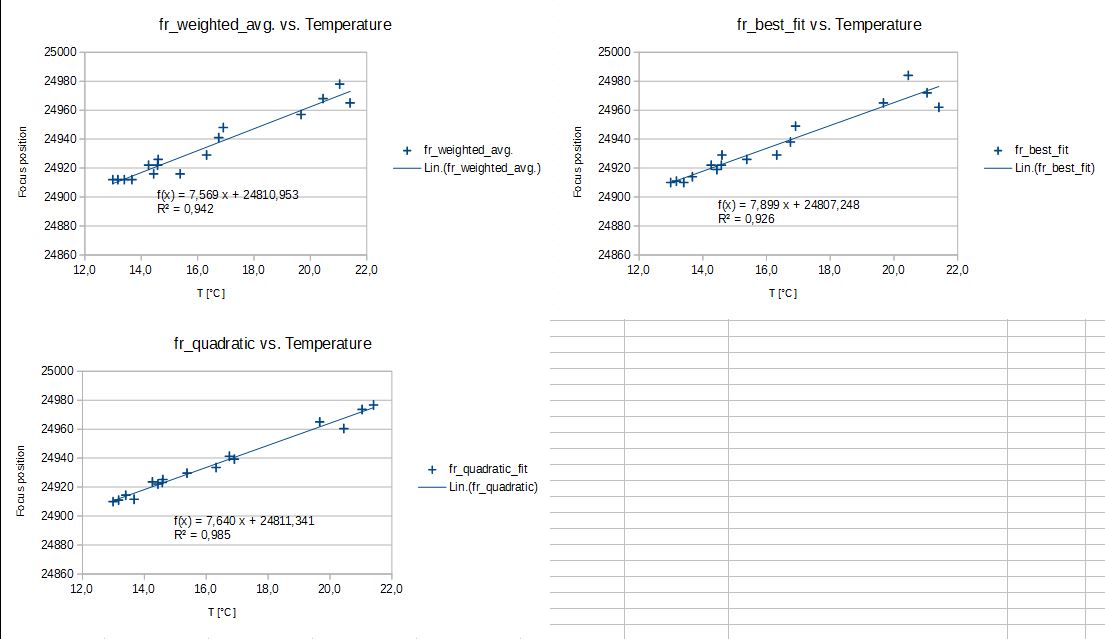
With the “Quadratic Fit” method I determined the fr values (= focus position at the minimum of the regression curves) for all AF runs and compared them with the results of SGP’s AF evaluation methods. Then I plotted the focus result values (fr) vs. temperature (T) separately for SGP’s AF evaluation methods and the “Quadratic Fit” method. For the sake of comparability in all three plots only the 16 AF runs were included which exhibited a R^2 > 0.95 in the quadratic fit. For the fr vs. T plots (temperature dependency) a linear regression was applied (image 4).

Assessment:
The comparison of these data shows that the “Quadratic Fit” method has important advantages compared to both of SGP’s AF evaluation methods:

  1. Distinct identification of poor AF runs
    There is a numeric criterion for the quality of an AF run: the coefficient of determination of the quadratic regression curve (R^2). This allows for the AUTOMATIC exclusion and repetition of poor AF runs. However, the exclusion of poor AF runs based on SGP’s AF evaluation methods seems not to be automatable and is highly subjective.

  2. Robustness against a single outlier of a HFR value
    The “Quadratic Fit” method uses all of the focus shots, in the evaluated AF runs that means there are 9 points for the regression. As a result the fr value are little influenced by a single outlier of a HFR value, i. e. the “Quadratic Fit” method is accurate and robust. In contrast SGP’s “Best Fit” method is strongly disturbed by a single outlier of a HFR value at the edge of a curve, and the “Weighted Average” method indeed is robust, but suffers from coarsely graded fr values. For this reason one can expect also a higher precision of the fr values obtained by the “Quadratic Fit” method.

  3. Correlation of fr values with temperature
    When comparing the plots of the focus result values (fr) vs. temperature (T), in the linear regression the “Quadratic Fit” method exhibited significantly higher R^2 compared with the two SGP AF evaluation methods. The correlation of the fr values obtained by the “Quadratic Fit” method with temperature was significantly higher than that of SGP’s methods (see image 4).

My conclusion is that the results of the “Quadratic Fit” method are more reliable than those of SGP’s AF evaluation methods. Therefore I propose to implement this method for the evaluation of AF results.

Bernd

3 Likes

Nice analysis. I think, however, that the focus curves follow a hyperbolic functional dependence rather than parabolic. For focus positions close to best focus, this can appear parabolic. From what I understand, the V-curve fitting will fit the more extreme edges of the hyperbolic curve where it’s more linear. By interpolating between these two linear edges, you get an estimate of the best focus position. Have you tried your analysis with a hyperbolic fit? In most cases though, if there’s a small difference between the hyperbolic and parabolic fit, it would likely be well inside the critical focus zone of your system.

Gabe

Something I wonder about is how universal this will be. A lot of the V curves I see posted look like Vs, not parabolas or hyperbolas.

Bernd, you seem to have an excellent scope and have taken care to get really accurate and reproducible focusing and so are getting very good data that fits your model excellently. But this is with a sample of one scope and I think it will need a lot more testing on a range of scopes and focusers before it could be implemented for everyone.

Hi Gabe,

Have you tried your analysis with a hyperbolic fit?

No, I didn’t, and I don’t quite understand this question.

The goal was: to fit the data and determine the minimum of the focus curve in the narrow region near the best focus. A quadratic equation worked exceptionally well. The good correlation is clearly visible if you take a look at the curves and it is measurable by the determination coefficient R^2 of the quadratic regression. So it doesn’t matter at all whether the true physical relationship over the whole range, i. e. far outside of this narrow region, is hyperbolic or parabolic.

However, you have not been responsive to the three advantages of the “Quadratic Fit” method that I mentioned:

  1. Distinct identification of poor AF runs (automatable),
  2. Robustness against a single outlier of a HFR value and
  3. Better Correlation of fr values with temperature
    How do you comment on that?

Bernd

Hi Chris,

Something I wonder about is how universal this will be. A lot of the V curves I see posted look like Vs, not parabolas or hyperbolas.

I suppose that is dependent on how far you get away from best focus. I only managed to get about 170 µm away from it, otherwise SGP wouldn’t detect any stars with my set-up.

…and I think it will need a lot more testing on a range of scopes and focusers before it could be implemented for everyone.

Yes, that is a point that counts. You are right, more testing definitely would be necessary. I have only one scope with a motor focuser and therefore cannot test with several set-ups. So I can only ask for support of others who are interested to give it a try, do some focus runs and evaluate the results as I did.

Bernd

Oh, sorry, correction: the 167 µm (= 25 * 6,67 µm)is the step size that I used, and the position far from focus was 667 µm (= 100 * 6,67 µm) away from best focus.

Bernd

My point is that when you get farther from focus, the focus curve no longer behaves as a parabola. In this range, the size of the defocused stars increases linearly as you go further out of focus and not quadratically. This indicates a hyperbolic relationship. I’ve attached an image to illustrate the idea. The blue is a parabola, and the red is the hyperbola. When close to best focus, it will look similar to a parabola.

I have no issue with the least squares fit method. It’s a good way of quantifying the result. I do think that some value can be added in going further away from focus though. Issues of potentially undersampling the star when near focus can spoil the HFR calculation. You don’t get that along the V part of the hyperbola. I’ve had some results bottom out in HFR near good focus because of undersampling. This goes to Chris’s point of testing it on other scope/ccd combinations.

Cheers,
Gabe

1 Like

Most people won’t have the tools or skill to reproduce your analysis, your best bet is to ask for people to provide you with the data that you need (a log file containing an autofocus run I guess) and then you can run it through your process to extract the focus data and do the analysis.

Gabe,

I do think that some value can be added in going further away from focus though.

As I already wrote, SGP didn’t manage to detect stars when I went beyond +/- 670 µm away from best focus. However, in order not to compare apples and pears we must define “near focus” and “further away from focus” in relation to the CFZ of the respective scope. There are different formulas for the calculation of the CFZ though, but it doesn’t matter: CFZ is proportional to (f-number)^2. So the values in the following table correspond to my max. distance away from best focus of 670 µm:

f-number   max. distance from 
    	   best focus [µm]
     4		 430
     5		 670   <==
     6		 960
     7		1300
     8		1700
     9		2200
    10		2700

I would like to hear about which max. distance away from best focus at which f-number people are using. Then we can discuss further, whether my set-up and my adjustments are wrong for SGP’s AF evaluation and impracticable for people using other scopes.

I want to add that in the other thread,

I got a response from one forum member who also sees parabolas, namely with his SN 10, thus a Schmidt-Newtonian:

Bernd

:wink: I think that’s rather a matter of effort than of skill, but yes: if someone using a different scope/camera combination than I provided a logfile, I would do that evaluation.

This only makes sense if

  • a properly adjusted focuser and
  • correctly adjusted backlash compensation
    is made sure. The set-up should be described in detail and the logfile should contain several successful focus runs, optimally at different temperatures.

Bernd

I think some kind of fit to the curve would be good and there are many options - but at the same time I find that if you have a nicely bowl shaped curve like the ones you show, the current system for finding focus based on two linear fits seems to work ok.

The focus curves I see here and in my own system often show asymmetries - so the model would need to include it.

If the curve is very v-shaped then I don’t think it is getting the full benefit it could from multi-star focus - which is particularly sensitive right near focus where it matters.

Opinions differ on that - but if I can’t see the final focus position in the context of other points nearby that are slightly ‘up’ along the bowl shaped curve - then I can’t be sure I’m really at focus - or how sensitive fwhm is to a slight change of focus.

So I don’t think this feature would help much since a good semi-parabolic curve is what you want - and the existing routine to find best focus works well with such curves - even when they are slightly asymmetric.

Frank

Hi Frank,

I think some kind of fit to the curve would be good and there are many options - but at the same time I find that if you have a nicely bowl shaped curve like the ones you show, the current system for finding focus based on two linear fits seems to work ok.

I disagree. Assume 9 data points as an example. Then the two linear fits use only (maximal) 4 points each. A single outlier would disturb the calculated slope of the straight line and influence the result strongly. On the contrary a fit to the whole curve uses all 9 data points and the minimum of the regression equation is little influenced.

The difference of the results of the three AF evaluation methods (which is the bottom line of the effort) is clearly shown in my last plot (fr vs. temperature), please take a look at the R^2 of the linear regression. I am really surprised that nobody seemed to take notice of that yet!

I am sorry, I only now realized that the right part of the third plot is cut off. Here it is again, hopefully uncropped:

The focus curves I see here and in my own system often show asymmetries - so the model would need to include it.

See bottom.

If the curve is very v-shaped then I don’t think it is getting the full benefit it could from multi-star focus - which is particularly sensitive right near focus where it matters.

Opinions differ on that - but if I can’t see the final focus position in the context of other points nearby that are slightly ‘up’ along the bowl shaped curve - then I can’t be sure I’m really at focus - or how sensitive fwhm is to a slight change of focus.

I don’t understand these two statements, please clarify.

So I don’t think this feature would help much since a good semi-parabolic curve is what you want - and the existing routine to find best focus works well with such curves - even when they are slightly asymmetric.

What does that mean: “… since a good semi-parabolic curve is what you want”? OK, I understand your fear that an asymmetric curve could not be fitted well because the quadratic fit implies a symmetrical curve (see above). In order to generalize one would not want to make any assumption on the “ideal” shape of the focus curve. The minimalistic implication is (mathematically spoken), that the curve is continuously differentiable (it does not make jumps) and has a minimum. Is that what you wanted to tell me?

On the other side, if you did a quadratic fit on an asymmetric curve the outcome would be a somewhat lower R^2, but the accuracy of the minimum of the curve would not be strongly affected. Since it is not the goal to compare focus runs taken with different set-ups: so what does it matter?

Bernd

I don’t really disagree that a fit would potentially help - especially when the curve is noisy. I’m just saying autofocus works fine for me as-is, as long as I get a repeatable bowl shaped curve - which I do, even focusing with the sct primary focus knob.

As for my v-curve comments - some people want the autofocus curve to show a sharp V instead of a bowl - I guess partly because focusmax is based on a sharp V model with one star. I disagree because a multi-star method benefits from actually going through focus and taking a curve - rather than relying on a model of how focus works for a given system (which is what focusmax does).

Frank

Frank,

OK, I understand that our opinions don’t differ that much. As to the question whether a change of the evaluation method is worth the trouble: I demonstrated that the quadratic fit resulted in a much better fit of the fr vs. T plots as compared with SGP’s methods. In other words: one can expect that on repetition of focus runs the distribution of the focus results will be narrower (the reproducibility will be enhanced). You tell me that you won’t need that. Strange. This is not comprehensible for me.

Also there are still two other advantages that I mentioned:

  1. Distinct identification of poor AF runs
  2. Robustness against a single outlier of a HFR value

That can be used for a quality control for the focus run and facilitates the automation of focus runs. You can think of the following: When the user has gathered experience with his system (scope/focuser/camera combination) he can choose a suitable threshold value for the determination coefficient R^2 of the regression curve. If the condition (R^2 >= threshold value) is met, the focus result is approved, otherwise an action will be triggered (that could be: repetition of the focus run, notification of the user, etc.).

Frank, I have a suggestion: would you be so kind and send me a SGP logfile with some focus runs? I then will retrieve and evaluate the focus run data and we can take a look together and see whether the asymmetry of the focus curve collides with the quadratic fit. Is that OK for you?

Bernd

If you do a search on quadratic or parabola with focus you will see this topic has come up a number of times.

There were big changes to the autofocus last year that helped with sct autofocus - and here is one thread with one of my parabolas:

My curves aren’t always that nice - but they are close - and I can see focus shift slowly during the night consistent with temperature change.

A key point in all this is that what matters isn’t the lateral offset of the focus error - but what impact it has on the fwhm. That’s why I say that as long as the focus position is found near the flat region of the bowl, it is good enough - particularly if a small amount of temperature drift in time would be greater than that error.

But it’s somewhat moot if the error is small in the first place.

Yes - it could reject bad ones and so forth and again I think such fits would be good given infinite development resources. But I have more pressing issues in terms of functionality and usability that I would give much higher priority.

Frank

@bulrichl, I think your work on this is exceptional. You have clearly demonstrated that your method works beautifully for your rig. I have no doubts that it will work perfectly for my rig, even though my right side always has a lower slope than the my left side.

I predict that it will work exceptionally well for practically every rig using SGP, and definitely a big improvement over the current focus routine.

Some people, quite reasonably, will disagree with these statements. I propose that people that don’t think this method will work well with their own focus curves send some of their curves to bulrichl and lets see what it can really do with them. If it proves to work as well as I predict, then lets all get behind this so we have a chance of getting the developers to actually fix the existing problems with the focus routine.

@bulrichl, could you please send me your code for implementing this routine? I develop software myself, so I am prepared to get serious about implementing this.

As a last resort, if the developers are not willing to make improvements in the current SGP focus routine, maybe we can figure out a workable way to implement your method as a third party add-on to SGP.

Bernd, you have done a great job with this work. Let’s get it implemented, one way or another. I have years focus curves for testing. Countless both good and bad curves. Lots of data to play with.

I also offer my help on this topic.

I’m a programmer, actually I’m the developer of Ardufocus (http://ardufocus.com) which started as a Moonlite clone but now can support sub micron movement per step, Smooth-Step acceleration curves and much more.

So we can go bananas end-to-end.

@jmacon and
@jbrazio

At that time (2 years ago) the most time consuming part was to extract the data from the large SGP logfiles. These days the task of data filtering can be quickly completed by mikaelA’s nice application “SGP AutoFocus LogViewer”, see SGP AutoFocus LogViewer - Auto Focus - Main Sequence Software .

If you want to send me some of your data, I’ll gladly will evaluate them. The easiest way would be to send SGP AF LogViewer logs of some of your AF runs.

Due to the low (and throughout negative) response that I got in 2017 I deleted all the data that is appended above as screen sections. However, it’s no problem. I am not a programmer and there was no programming involved from my part at all. I only used the free spreadsheet software LibreOffice for the evaluation. The data (x: focus position, y: HFR value) were plotted in chart type XY (Scatter) with a polynomial trend line, degree = 2. The functional equation (f(x) = a * x² + b * x + c) and the coefficient of determination R² are calculated in LibreOffice. (Of course, any other spreadsheet software like Excel or OpenOffice will do just as well.)

Bernd