The newest version 1.2 of the AF Logviewer is now available here:
The main changes are the ability to handle and display the quadratic curves of the new AF routine used in the 3.1 betas (the program should still be perfectly backwards compatible with SGP 3.0), the ability to read multiple logfiles at the same time, and an improved Position vs Temperature analysis with filter selection including an filter offset calculation.
Big thanks to @jmacon and @bulrichl for proposing the filter offset calculation method, and for doing a lot of the beta testing! Please signal any other bugs here.
The detailed change log reads as:
Version 1.2
Change: multiple file reading now possible (multiselect enabled in the file selection dialog). Logfiles are given file IDs according to their filename, which are used to identify the run in the summary output and AF graphs.
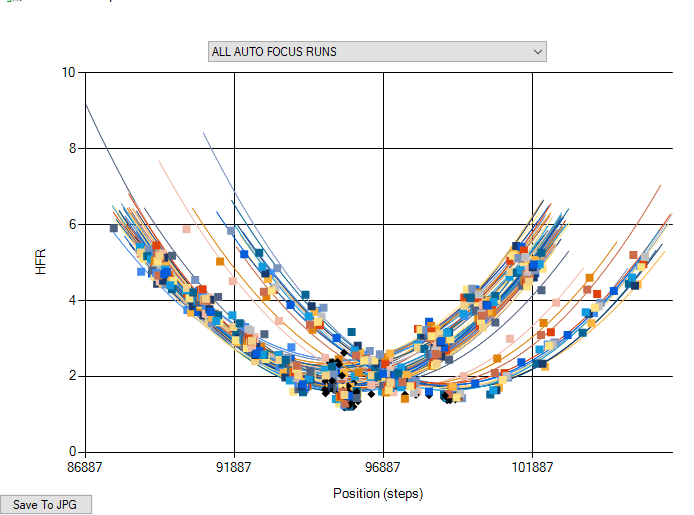
Change: AF runs generated using the new quadratic AF routine (3.1 betas) are plotted together with the best-fit quadratic function as logged by SGP. The validation frame is highlighted using a black diamond symbol. AF runs from older logfiles are plotted as lines that connect the dots.
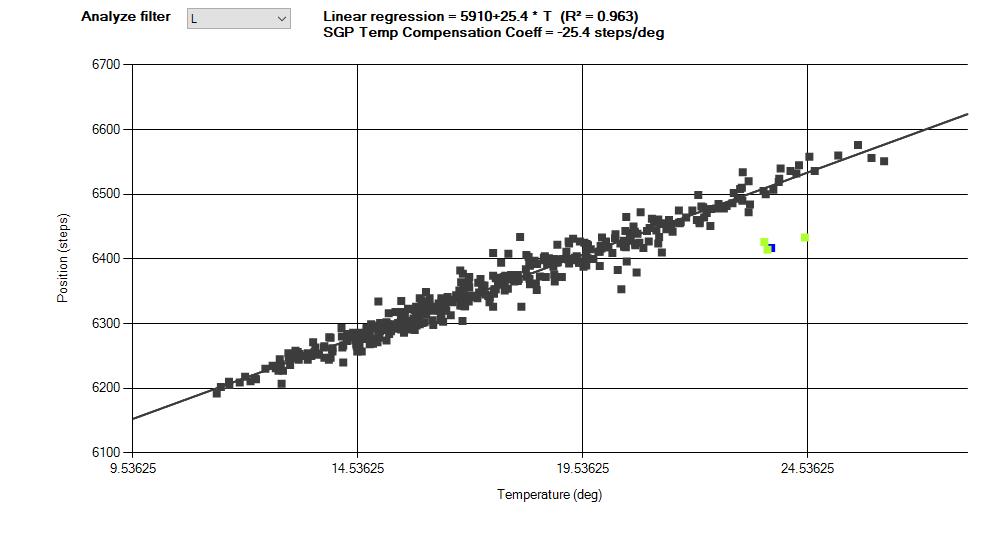
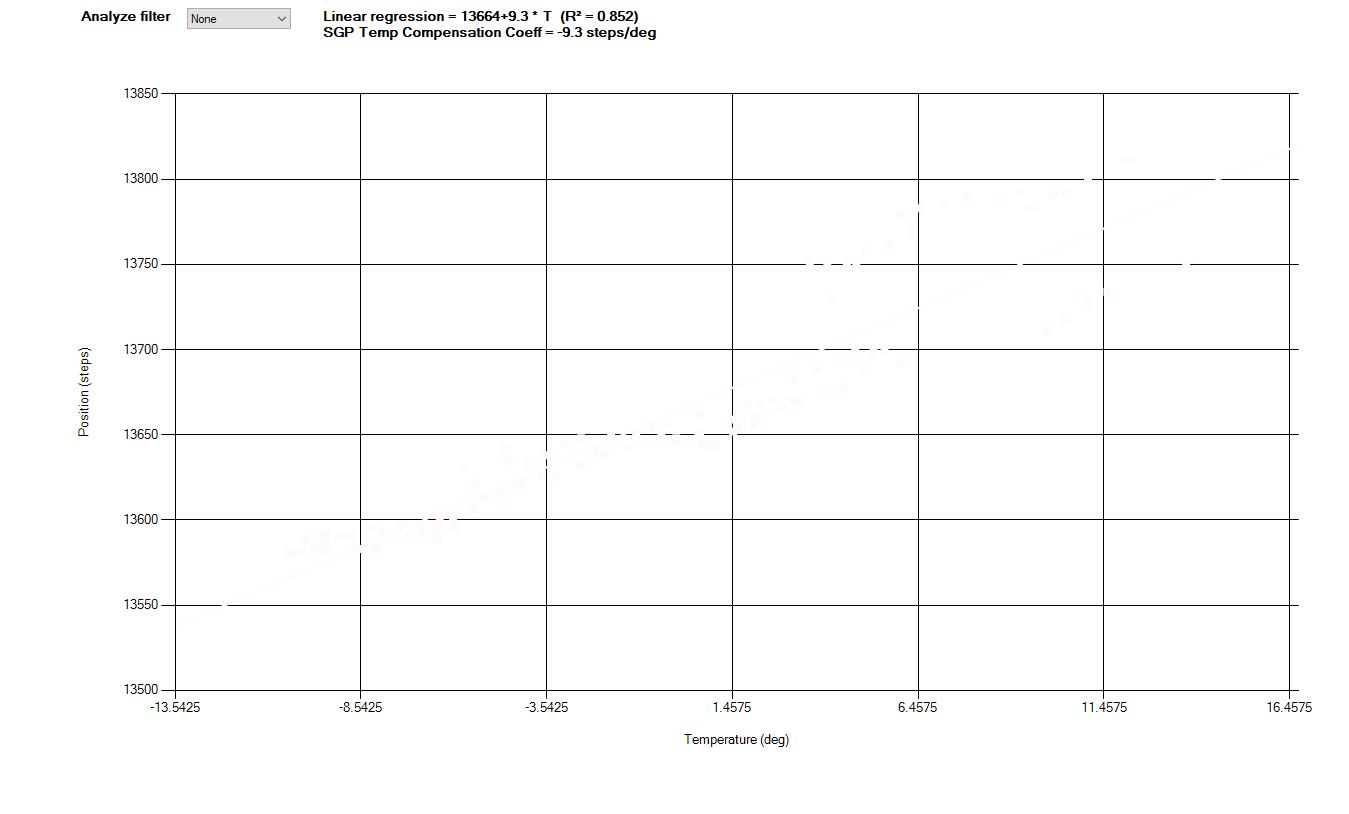
Change: The Position vs Temperature graph now has a dropdownlist that allows analysis of specific filters. The fitted linear slope is plotted for each filter, with the R^2 factor displayed. The lines are color coded according to commonly used filter names (R,Red,RED,etc…)
Change: The summary text output has an improved display of the linear regression result for each filter.
Change: IF more than one filter was used for AF, a filter offset calculation using the “mid temperature” method is shown (big acknowledgement to Jerry and Bernd for the method!). Basically filter offsets are calculated using the linear regression results, evaluated at the average temperature of all AF runs.
Change: The scan details output has been moved to a separate form. Messages related to the new quadratic AF routine are now displayed.
Change: “Save to JPG” buttons have been added to the AF graph and the Position vs Temperature graph. No need to make cumbersome cropping of screenshots for posting graphs on the forum! The JPG shows whatever AF run (or Filter) has been selected. To save more runs (or filters) one has to select them and press the “Save to JPG” button. Filenames are coded according to the selected AF run (or filter).
I want to highlight the ability to read and analyse many logfiles, by showing the result of a bunch of log files (22 files !) provided by @bvalente . These include a total of 410 AF runs!, spanning more than 1 month. The resulting position vs temperature analysis is quite amazing, with a very accurate fit of the linear slope that is used for temperature compensation in SGP.
And here is an example of filter offset analysis, using logfiles provided by @jmacon. Here Jerry has cycled through all filters (L,R,G,B,H,OIII) during a total of 8 hours (!), resulting in 158 AF runs (!!). This allows a very accurate analysis of the linear slope of each filter, and the filter offset calculation.
FILTER OFFSET CALCULATION
Filter offset calculation using the linear regressions.
Offsets are calculated at the middle temperature of 45.1 deg
Filter Lum : 0 steps
Filter Red : 7 steps
Filter Green : 3 steps
Filter Blue : -10 steps
Filter Ha : -17 steps
Filter OIII : -24 steps
Just testet it an already found a bug, for position vs te temperature graph i’m only able to exclude 1 color (i’m trying to exclude data points after meridian flip, would it be possible to add it as an automatic option to exclude/separate 1 side of the meridian?)
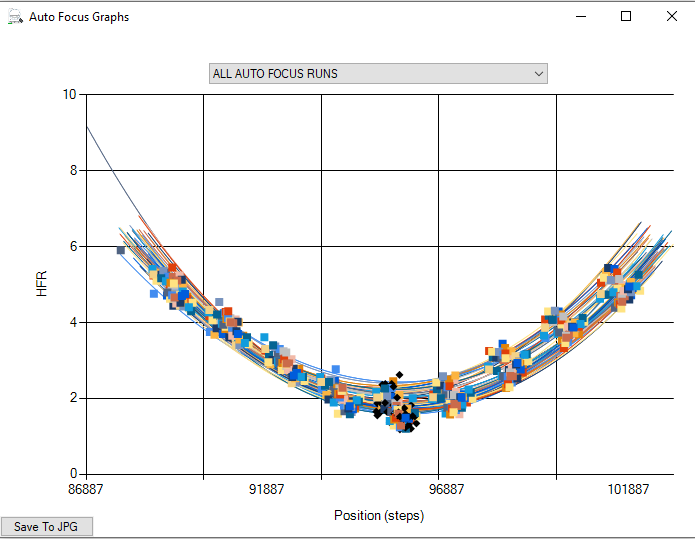
As can be seen here there’s 2 groupings of autofocus runs, i confirmed they are before and after meridian flip.
Suggestion 2:
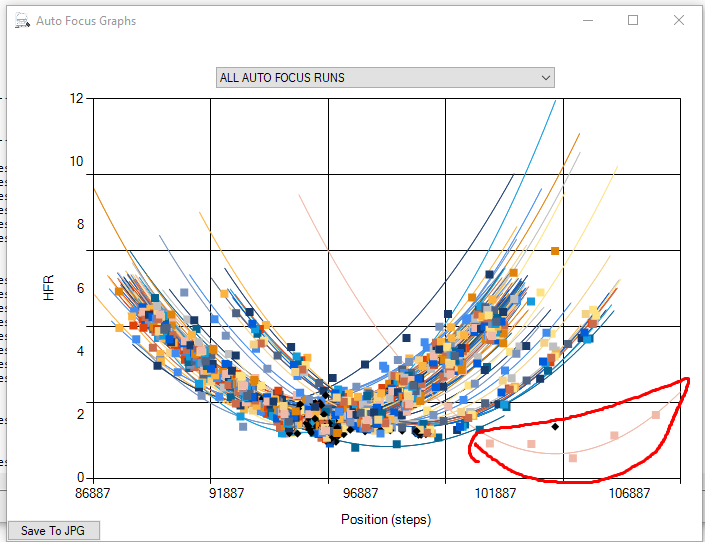
Add the ability to exlude focus runs in the graphs, as can be seen in the graphs there there is a big outlier that i would love to be able to exlude from the data.
Maybe add a tick box besides the dropdown box?
I forgot to put into the changelog that this part of the code is BROKEN as of now, due to the many changes done to include the ability to do the analysis per filter. I will try to fix this, but it turned out to be tricky due to the way I coded it. So for now you cannot exclude points.
As for screening data based on the meridian flip, that might be really tricky. Not sure how to do that based on what is logged.
Ok, I’ll look into this. Might be easier than I expected.
A crude solution would be to split the logfile into 2 files based on the hour of the flip, and analyse them separetely. I haven’t tested that thought.
I agree that the exclusion of AF runs and data points is very useful. But I felt I had lingered enough regarding posting this new version, so hence I posted it. Clearly I need to address this when I have time.
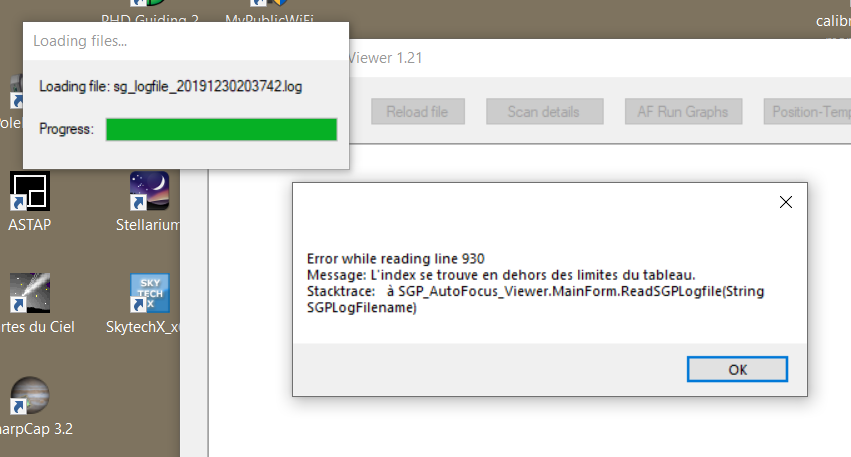
I’ve uploaded v1.21 which includes the .log extension in the file selection dialog. This is the new file extension used in the SGP 3.1.0.402 (Stable) release and some earlier betas starting with 3.1.0.388.
I reported this issue to Mikael on 24th December but did not get a response from him yet. Probably he is on vacation.
A temporary workaround is:
In an editor, find all “[SQ;AF;]” and replace by “[AF]”. Then save the modified logfile. Apply SGP AF LogViewer to the modified logfile.
I have been a user of the AF Log Viewer for awhile now and it is great! Thank you for creating this for us.
I do have one issue though. If I open many SGP logfiles, the position-temperature graph will plot in colors that cannot be seen on the background of the graph. See attached.
No big changes, some small bug fixes, and adding the Quality factor to the output table. The change log:
FIXED BUG: handles exception when no temperature data can be found
FIXED BUG: only assign random DARK colors in the pos-vs-temp plots (used in case the filter name cannot be identified)
Change: added quadratic fit “Q” quality parameter to the output table (when reading older SGP files using old AF routine the parameter will show NA by default). Also shows minimum quality factor “min Q” used by SGP to qualify succesful runs. This is by default 90%, but the program will detect if ‘quadratic_fit_min_quality’ has been set by user
Change: added black as the default color of the “None” filter name (used in pos-vs-temp plot)
One issue: my Ha filter (named Ha) shows up in the data as Filter. Example:
Filter Filter : a = 0.0 steps/deg, b = 0 steps, SGP factor: 0.0 steps/deg
One request: I cannot find a table of the focus position vs. HFR for the focus runs. I would like to further analyze the focus data and combine with other session focus runs. Can you generate a table with all the data for each focus run, including which filter, etc.? If it already exists, where can I find it?