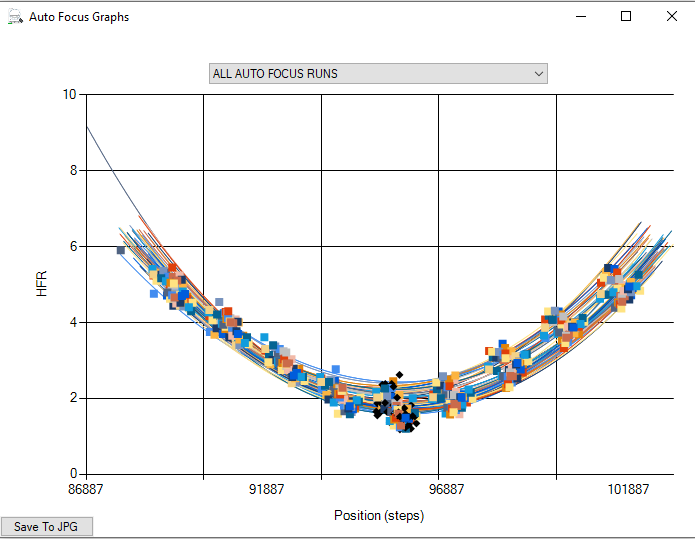
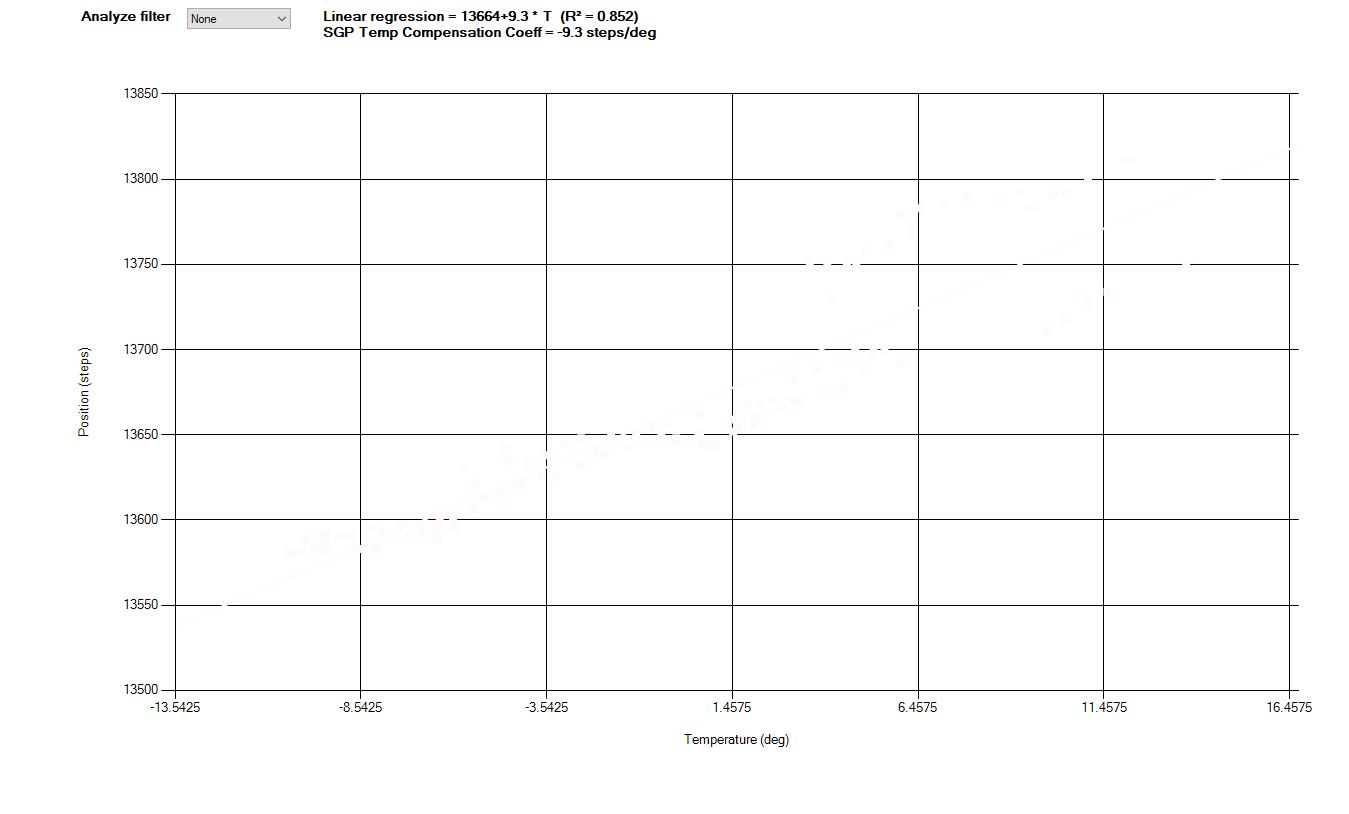
I split the file manually and ended up with this which is definitely usable data 

I’ve uploaded v1.21 which includes the .log extension in the file selection dialog. This is the new file extension used in the SGP 3.1.0.402 (Stable) release and some earlier betas starting with 3.1.0.388.
Please download the AF logviewer here:
Mikael
Hi,
I’m unable to load a log file with this logviewer
Log file is here https://drive.google.com/open?id=1wgEgKfnCm1JWknQ60xJnBM7PJHSBJkCl
It do the same with all log files included autofocus run. I use the latest release of SGP
This error is correlated to the insertion of additional information into the logfile, see Ken’s explanation in SGP Log Viewer - #5 by Ken - Sequence Generator - Main Sequence Software .
I reported this issue to Mikael on 24th December but did not get a response from him yet. Probably he is on vacation.
A temporary workaround is:
In an editor, find all “[SQ;AF;]” and replace by “[AF]”. Then save the modified logfile. Apply SGP AF LogViewer to the modified logfile.
Bernd
thanks for the explanation and the workaround
The error has now been corrected. Please download v1.21 again and re-install:
Mikael
I have been a user of the AF Log Viewer for awhile now and it is great! Thank you for creating this for us.
I do have one issue though. If I open many SGP logfiles, the position-temperature graph will plot in colors that cannot be seen on the background of the graph. See attached.
Can you change that so that the elements on the graph are high contrast?
Thank You,
Greg
Thanks for the feedback Greg!
Yes, I’m aware of the contrast issue, although I haven’t quite seen such an extreme example before.
I’ll try to find a solution as soon as I get time. I’ll post here when it is available.
Mikael
Version 1.22 of the AF Logviewer can now be downloaded from here: SGP AutoFocus LogViewer - Browse Files at SourceForge.net
No big changes, some small bug fixes, and adding the Quality factor to the output table. The change log:
- FIXED BUG: handles exception when no temperature data can be found
- FIXED BUG: only assign random DARK colors in the pos-vs-temp plots (used in case the filter name cannot be identified)
- Change: added quadratic fit “Q” quality parameter to the output table (when reading older SGP files using old AF routine the parameter will show NA by default). Also shows minimum quality factor “min Q” used by SGP to qualify succesful runs. This is by default 90%, but the program will detect if ‘quadratic_fit_min_quality’ has been set by user
- Change: added black as the default color of the “None” filter name (used in pos-vs-temp plot)
Mikael
There is an additional change I forgot to put on the list:
- “Show all AF runs” check box added. If checked then aborted/failed runs will also be shown. By default it is unchecked.
Hi Mikael,
great app. Thanks for adding the quality value to the table.
Mark
Mikael,
Ran V1.22. Excellent job.
One issue: my Ha filter (named Ha) shows up in the data as Filter. Example:
Filter Filter : a = 0.0 steps/deg, b = 0 steps, SGP factor: 0.0 steps/deg
One request: I cannot find a table of the focus position vs. HFR for the focus runs. I would like to further analyze the focus data and combine with other session focus runs. Can you generate a table with all the data for each focus run, including which filter, etc.? If it already exists, where can I find it?
Thanks,
Mark W
Mark,
If there were runs qualified as successful (i.e. quality factor > 90%) in your logfile there should have been a table with the data you seek in the main text window. Sounds like something went wrong while scanning the file. Please post a link to the file on this forum, and I’ll have a look.
The program can also read multiple logfiles and analyze for instance the focus position vs. temperature, or filter offsets, from multiple files. You simply select all files you want to analyze together in the open file dialog.
Mikael
Mikael,
The runs were successful with fit Q from 94 to 99%. The table in the log app text window has the table of the final results for each run which is very useful. I cannot find the data used to make the AF plots, HFR vs. position. I like to use Excel to do some calculations on a variety of runs and make a different set of plots. Since you extract the data points from the focus run log, could you make the raw data available or exportable?
Mark W
Yes this is possible. Start the program using the command prompt and add a switch “-o”, eg.
C:\Program Files (x86)\AlcorSoftware\SGP AutoFocus LogViewer 1.22>“SGP AutoFocus Viewer.exe” -o
This will enable an option that automatically saves the raw data to a text file, you can choose path and filename.
Mikael
And Mark, you also had an issue with the filtername ? I’ll need the logfile to look into it.
Mikael,
Thanks! Works great.
Mark
Mikael,
Attached is my log file. Ha is labelled as Filter.
Mark
(Attachment sg_logfile_20200227182303.log is missing)
The forum doesn’t allow attaching files anymore. Can you post a dropbox link or similar ?
Mikael
Hi folks,
I’ve posted v1.23 of the SGP AF Logviewer: SGP AutoFocus LogViewer - Browse Files at SourceForge.net
As always, if you experience problems or have suggestions for changes, please post a message here.
The changes made are these:
Version 1.23
- FIXED BUG: fixed problem with saving path upon closing application
- FIXED BUG: fixed problem with AF run number in “Scan details” window when option “Show all AF runs” is enabled
- NEW: The text outputs of the “AF Run List” and “Temperature and Filter Analysis” have been separated into two TABS for better readability
- NEW: For more than one filter the average temperature compensation factor is calculated
- NEW: The ability to exclude/include AF runs for the temperature analysis has been re-inserted (it was removed when multiple filter analysis was introduced). This allows for excluding outliners. By click on a point in the temperature vs. position graph one can include (square symbol) or exclude (cross symbol) a point. The linear regression curve will be re-calculated and the text output in the “Temperature and Filter Analysis” tab will be updated. In addition, a check box in the corresponding AF graph will show if the Run is included or excluded. The checkbox can also be used independently to perform the same task. These features also work for multiple filters.
The way the last feature works is shown on this screenshot:
Mikael


